Inhaltsverzeichnis
General reports
Database queries in LOGO CRM
Introduction
With general reports you can start a database query in LOGO CRM. The queries can be saved to be used or changed at a later date. Other users can then use them and – if necessary – add to them.
Use General Reports to create
- internal reports
- specific customer evaluation
- recipients for the mailing manager
The results of the general report can be displayed
- on your monitor (inside your LOGO CRM window)
- on your monitor in a separate browser window
- as a .csv file
Please note, that with general reports you are not saving the result of the query but the query itself.
If you start the report again at a later time, the query will be run through the database again.
This assures, that you will always receive the most recent data as a result.
Example:
In 2012 you have saved a query about all contacts with the mailing category “Newsletter”.
If you run the query again in 2013, all customers will be shown, even those who were added after you initially made your query, and those whose mailing category has changed since then.
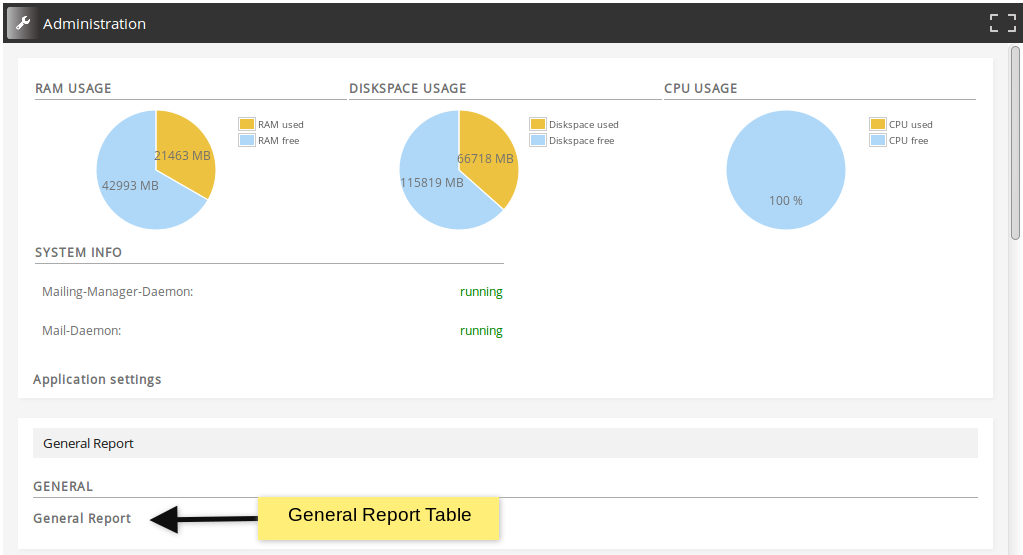
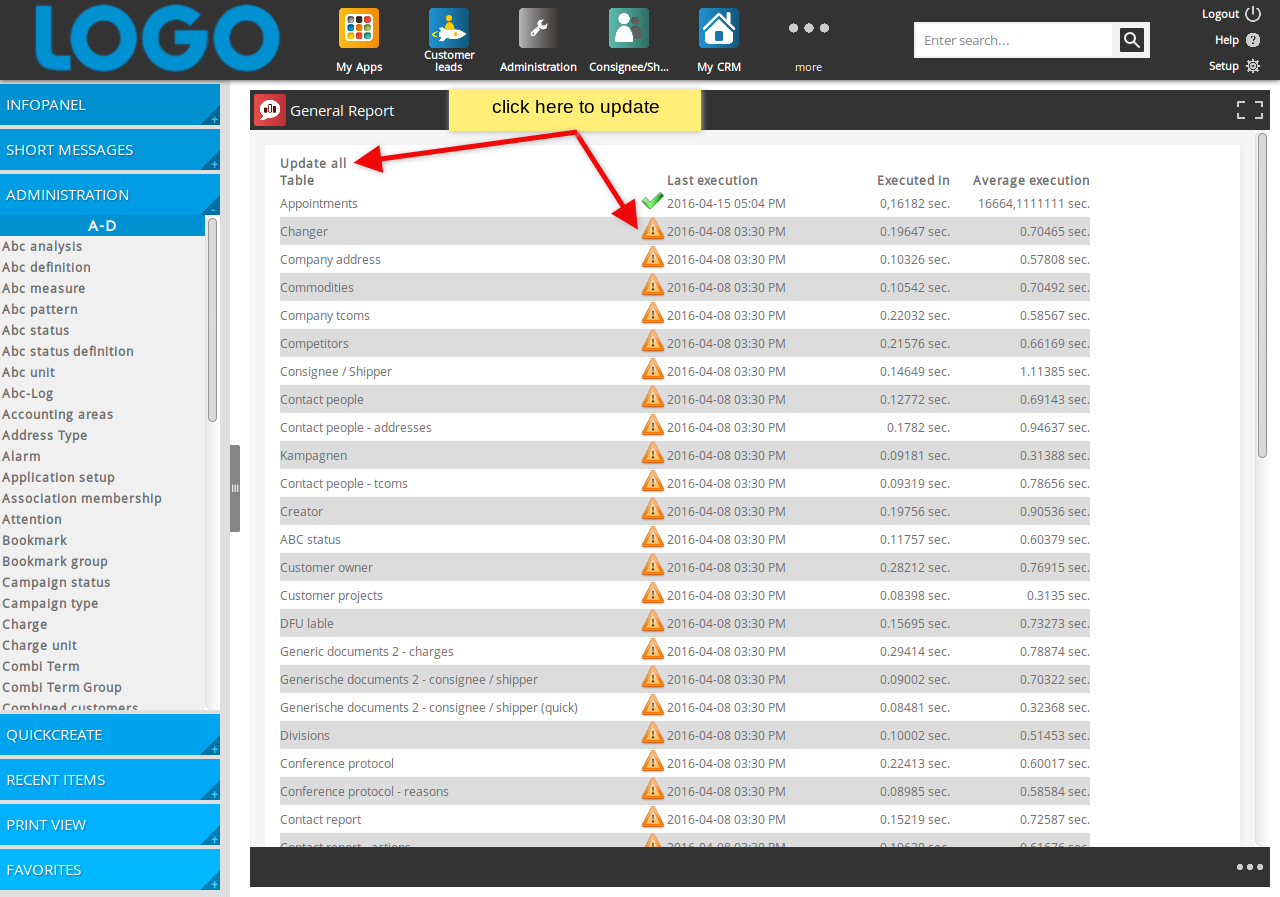
Update the general report databases
Usage of the General Report
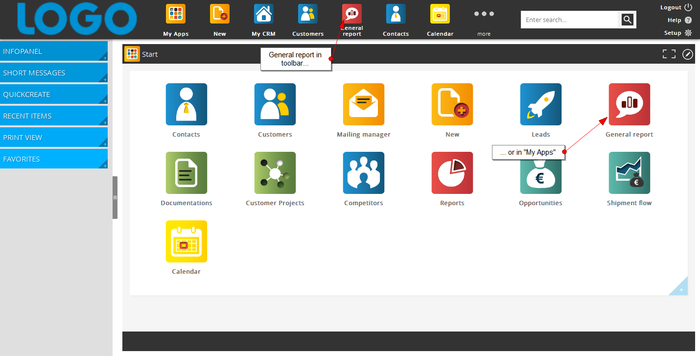
General reports can be found on your home screen or your toolbar.
They are also used in the mailing manager
Step 1: Choose output columns
The result of your query will be a table. This mean you first need to decide, which columns your table should have. Those are the so called “output columns”.
The result of your query will be a table. This mean you first need to decide, which columns your table should have. Those are the so called “output columns”.
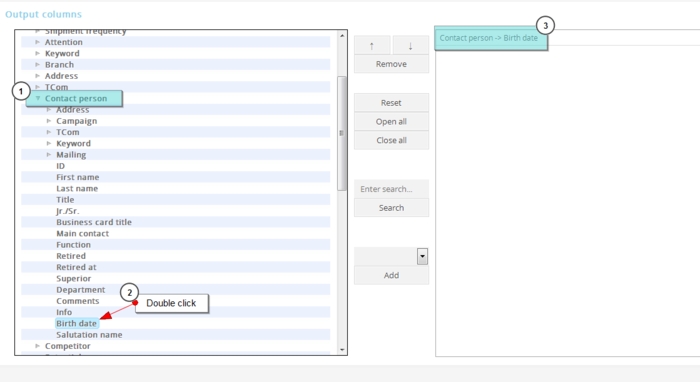
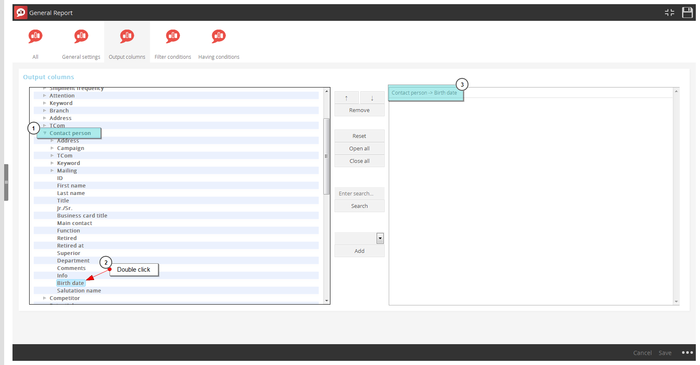
First you choose your output columns. You can add those over the button “Add”. A double click on the column name also add this column as output column.
The tree structure used to show the fields/columns represents the data structure of the CRM.
Example:
If you would like to show the birthdays of all contacts to make a birthday list, first click on “customer”. Now the trees opens to show the next level.
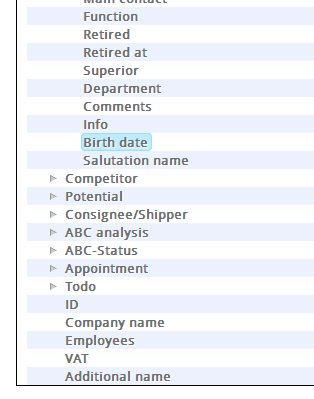
Scroll down until you see “contact” and click on the little arrow again. Now you will see the fields that can be searched and shown for a contact, for example the birthday.
Now also add the contacts surname and also the company that he belongs to. For that, close the branch “contact” by clicking on the arrow again. Then scroll down, until you can see the field “company name”.
Add with function
Adding with function means that you are doing a calculation on a column. With function columns there is a return of only one row, which only contains the result of the calculation.
| Type of column | Available functions |
| Text | Quantity |
| Numerical | Quantity, Maximum, Minimum, sum and average |
| Date | Maximum, Minimum |
| other (e.g.Logical yes/no) | No functions |
Example: turnover of customer xyz
Let's say, customer xyz has 5 shipments. You can get them with general reports with:
Output columns
Customer → Company name Shipments → turnover
Filter
Customer → Company name is xyz
The result will be the five shipments and their turnover:
| Customer → company name | Shipment(s) → turnover |
| xyz | 2 |
| xyz | 10 |
| xyz | 40 |
| xyz | 60 |
| xyz | 300 |
Now you change the output columns like this:
Output columns
Customer → Company name Quantity(Shipment(s) → turnover)
The result will look like this
| Customer → company name | Quantity (Shipment(s) → turnover) |
| xyz | 5 |
Output columns
Customer → Company name Maximum(Shipment(s) → turnover)
Your result will be:
| Customer → company name | Maximum (Shipment(s) → turnover) |
| xyz | 300 |
Output columns
Customer → Company name Minimum(Shipment(s) → turnover)
Your result will be:
| Customer → company name | Minimum (Shipment(s) → turnover |
| xyz | 2 |
Output columns
Customer → Company name Average(Shipment(s) → turnover)
Your result will be:
| Customer → company name | Average(Shipment(s) → turnover)) |
| xyz | 82,4 |
Deletion
If you want to remove an output column, simply delete it by clicking on “remove”
Change order
The order of the output columns in your list also determines the order in your result. To change up the order, move the columns by clicking on the arrow symbols.
Search
Through “search” you can filter the tree. Simply enter the field name and hit search. The system now finds and highlights all matching fields, so you can find them easily.
The button “reset” deletes the search filter and returns to a complete tree view. Once you have chosen your output columns and put them in the right order, scroll down for the next step.
Step 2: Defining filters
General reports with a large number of results need a lot of computing power. That leads to longer loading times for other users and for you. That is the reason, why you should make sure your report only shows the results you need. If you have to run a large report, it is best to do so when less other users are using the system.
Filters make sure you only see things relevant to your report.
Example:
Filters for zip-code, so you can find all customers in a certain zip-code area. By clicking on “add” you select the columns that should be filtered. When doing multiple filters make sure you connect them properly with AND and OR ( see connections)
Brackets
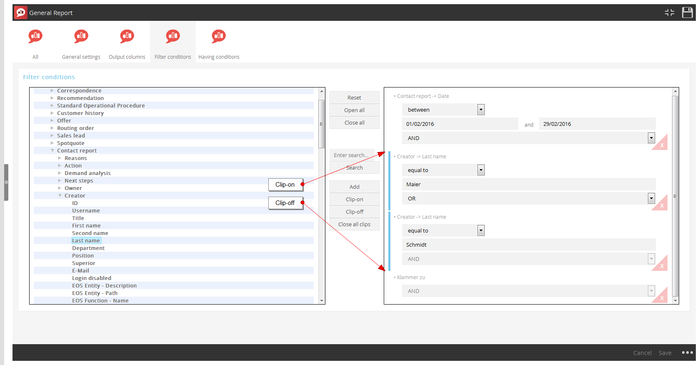
When filtering on multiple columns, you can choose the order of filtering by using the “clip on” and “clip off” buttons.
Example:
You want all contact reports from two employees for the month of February.
If you filter without brackets “Contact reports in February” and “Contact reports from Mister Maier” and “Contact reports from Mister Schmidt” your result will be all contact reports from Mister Maier in February and all of Mister Schmit's contact reports.
This means, you'll have to put “Date, clip on, Employee 1, Employee 2, clip off”.
Operators
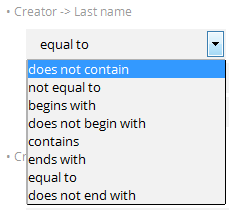
Each columns has different operators available to specify, how to use the filter.
In text columns you have these operators to choose from:
connections
Filtering on multiple columns allows the use of “AND” and “OR”.”AND” will use the filter on both entries, while “OR” uses the filter on one of the columns or both.
Example: You want to find the contact reports for Mister Schmidt and Mister Miller. The query will be “All contacts reports that were create either by Mister Miller or Mister Schmidt”. The connector here is “OR”. The wrong way is “AND”, because there will be no contact report that was created by Mister Miller and Mister Schmidt.
Step 3: Set having-conditions
The step having-conditions lets you created more complex queries. For example for customers, who don't have a certain characteristic. Please contact us if you plan a report like this, will will help you with it.
Step 4: Set order of results
In “sort” you can choose a columns, after which the results will be sorted. You can also set the direction of your sorting (descending or ascending)
Example:
You create a report about spot quotes in the first quarter of the year and request the EDP status.
The list can be sorted in many different ways. Company name, customer owner, document owner, EDP status or creation date.
The field “sort column” offers you all selected output columns. Select your choice an also select the direction of the sorting (descending or ascending).
Step 5: Choose output format
You can show the result of your report in a csv-file, directly in your browser in a datagrid or in a new window.
The different formats have different advantages.
Datagrid
With the option datagrid the report will be shown to you right inside your LOGO CRM window. From here you can instantly edit or save the general report.
CSV
CSV stands for “comma separated values”. This means a file is created, where the values are separated by commas. If you want to convert your result into a excel table and edit it there, choose csv. Please note that special characters are only shown properly in UTF-8.
Datagrid (Po pup)
Choosing “datagrid in ext. window (popup)” opens a new browser tab or window with your results. The other window or tab keeps the LOGO CRM open. Double clicking on a specific row lets you automatically jump to the customer file. This popup lets you go through lits easily, since one window has the results and the other keeps the CRM open.
Example:
You want to check, if every new customer created in the pat years has the correct mailing category for a Christmas mailing. You create a general report about all customers created after the date xyz. The list opens up in a new window and you can now check every customer one after another for their mailing category, adding it if needed.
Step 6: Save / Run report
Choose a goo and specific name for your report (e.g. All customer with positive offers 2012) and select the proper right from the EOS. This allows you to crontroll which Users can see and run your general report.
This lets skilled users create general reports which can be used by other employees, who might not know how to do them.
Results from a general report can change, depending on the user and his rights!
Clicking on the disk will save your query.
Depending on the amount of data and the complexity of your query, the results can take a couple of minutes to load.
The results will be shown in whatever output format you have chosen.
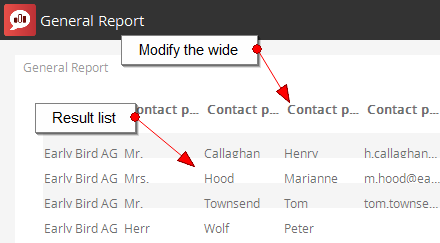
The following screenshot shows, how a general report window looks after you have run the query. The columns width can be changed to allow all content to be read.
Edit existing reports
Once a query has been saved, you can always edit an change it.
To do that, use the action links after choosing a general report from the list.
Here you can change the settings. Please note that changes only take effect after you have saved them.
If you want to see the new result of your changed report, click on the action link “show report”.
The action link “Save report as…” only shows up when the report has already been saved once. This lets you duplicate your query or save a slightly changed query without overwriting the original.
Rules
Sometimes the results of your query will not be what you expected. Partially this can be be because of LOGO CRM's data structure, partially because of the nature of SQL-queries. Here are a few notes on it:
- Usually every customer has one main address. If the customer has two, it has been merged with another entry. The user has now the responsibility to correct this himself.
- A customer having multiple addresses influences the result. Asking for the address and getting multiple rows back isn't an error. The server cannot tell which the right address is and returns all.
- Queries over the Mailing Manager notice if a contact is double. They will be merged into one result.
